Dropwizard and Datadog
This is a basic walk-through of standing up a Java Dropwizard on a production host with Datadog monitoring. I do not work for Datadog, but I am interested in comparing it with Prometheus (which I am walking through in another blog post).
I will not go over all of the details to explain why I have chosen Datadog for this stage, but elevator pitch boils down to - fair price, solid feature set, handy overlap of application and host monitoring tools that would let you avoid multiple separate products.
Getting Started
Dropwizard: This assumes you have a basic Dropwizard service already (you can follow my guide here: /new-dropwizard-1-0-5-java-service/ if you need one still).
Datadog: First head over to Datadog and start your free trial - https://www.datadoghq.com/
Host: Chose the host you want to run and monitor your Dropwizard service on. I went with the smallest Digital Ocean droplet running Ubuntu 16.04 ($5 dollars a month and you can pay smaller amount if your turn off the droplet when not in use). https://www.digitalocean.com/
- You could also just run this all locally. I am particularly interested in validating all of this behavior works on cheap instances of someone else's hardware.
Installing the Agent
This is where you have a choice to make. There are several ways to run the Datadog agent.
- Run the agent directly on the host.
- Run the agent from a Docker Container running on the host.
- Run the agent in the same Container that is running your Dropwizard service (assuming you have containerized your Dropwizard service).
Datadog Agent on the Host Machine
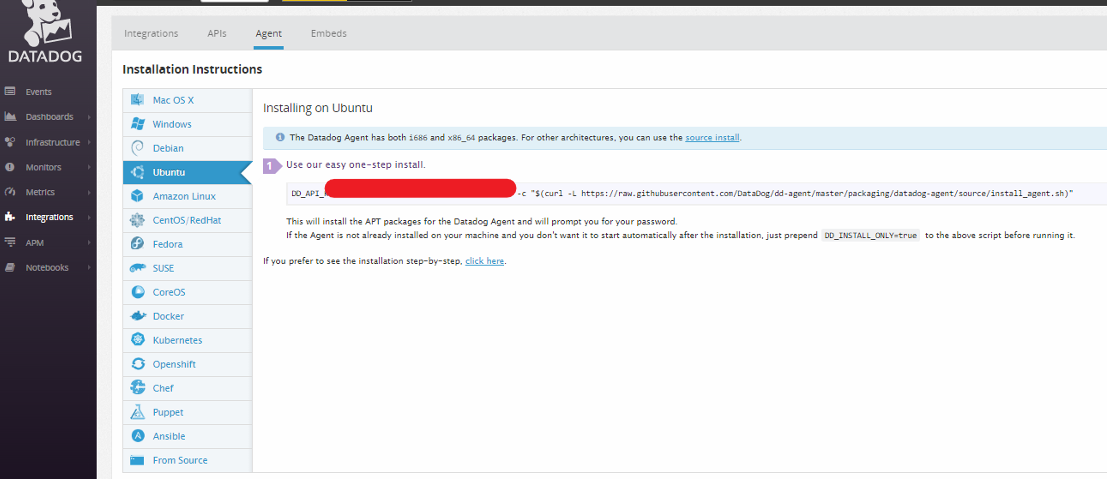
You will need to go through the Datadog guide so that you can use your assigned API key - https://app.datadoghq.com/account/settings#agent/ubuntu
- Helpful reference for restarting and managing the agent once you have it running on Ubuntu - Basic Agent Usage for Ubuntu
You should be able to verify the host is now being monitored (you can get there via the Dashboard section or the Infrastructure section of Datadog.
Monitor Dropwizard Running Directly on the Host
So if you have Datadog running on the Ubuntu host, you can go ahead and fire up your Dropwizard service directly on the host (minus a container or any of that goodness) just to see how the Datadog Java integration works (it relies entirely on JMX to collect java metrics).
I would suggest you review the Datadog documentation - http://docs.datadoghq.com/integrations/java/
- I was totally unfamiliar with JMX when I started this.
- A nice overview of the basics - without this I would not have been able to figure out the require jvm parameters to actually get things running http://docs.oracle.com/javase/1.5.0/docs/guide/management/agent.html
- Here you can see where Oracle has organized all of the documentation they think is relevant to JMX http://www.oracle.com/technetwork/java/javase/tech/javamanagement-140525.html
Start Dropwizard
First you need to configure JMX for the jvm you are going to use, I did that by (Ubuntu 16.04 specific here for a default install of the OpenJDK8) - Reference
# You need to edit the user and password.
emacs /usr/lib/jvm/java-8-openjdk-amd64/jre/lib/management/jmxremote.password
# Make sure to change the file permissions on the password to readonly.
chmod 400 /etc/java-8-openjdk/management/jmxremote.password
Start your Dropwizard service (you can just use SCP to move the Jar and the yaml file over):
java -Dcom.sun.management.jmxremote -Dcom.sun.management.jmxremote.port=7199 -Dcom.sun.management.jmxremote.ssl=false -jar dropwizard-sample-0.0.1-SNAPSHOT.jar server hello-world.yml
Explanation of the parameters:
-Dcom.sun.management.jmxremoteEnable JMX-Dcom.sun.management.jmxremote.port=7199Set the JMX port - I set the default here.-Dcom.sun.management.jmxremote.ssl=falseDisable SSL This is not recommended for production or secure.
Configure the Datadog Agent
Now you need to tell Datadog how to go find the JMX metrics you just opened up on the Dropwizard service.
If you are running on an Ubuntu host (Datadog will place its configs on a host specific location - Basic Agent Usage for Ubuntu
This is the Datadog JMX config I started with (you need to create a config in /etc/dd-agent/conf.d/ I didn't get much from the example config cat /etc/dd-agent/conf.d/jmx.yaml.example.
Create a /etc/dd-agent/conf.d/jmx.yaml
instances:
   - host: localhost
     port: 7199
     user: <INSERT_USER>
     password: <INSERT_PASSWORD_HERE>

init_config:
  conf:
    - include:
        bean: metrics:name=com.example.helloworld.resources.HelloWorldResource.sayHello
        attribute:
          Count:
            alias: sayHello
    - include:
        bean: metrics:name=ch.qos.logback.core.Appender.error
        attribute:
          Count:
            alias: logback-error
    - include:
        bean: metrics:name=org.eclipse.jetty.util.thread.QueuedThreadPool.dw.size
        attribute:
          Value:
            alias: QueuedThreadPool-size
- There is a ton of stuff going on here for the different bean's referenced. Why should you care? This is how you tell Datadog what stuff to collect from JMX. It will take 350 metrics at the time of writing, and you should take advantage of that because the defaults don't give you much.
- Theoretically you should be able to figure everything out from http://docs.datadoghq.com/integrations/java/ BUT I was not able to. It took significant trial and error for me to figure out what I needed to reference for the bean, and how to find these in the Datadog UI once I got them getting scraped by Datadog.
- We will discuss primarilly the sayHello endpoint. Note that ALL we had to do from our Dropwizard tutorial was annotate the GET endpoint as @Timed. At least for this project, I didn't need to configure anything else from the metrics library to get this working /new-dropwizard-1-0-5-java-service/ or my public repo - https://github.com/AnthonyHonstain/dropwizard-simple-skeleton/blob/master/src/main/java/com/example/helloworld/resources/HelloWorldResource.java
@Path("/hello-world")
@Produces(MediaType.APPLICATION_JSON)
public class HelloWorldResource {
    private final String template;
    private final String defaultName;
    private final AtomicLong counter;

    public HelloWorldResource(String template, String defaultName) {
        this.template = template;
        this.defaultName = defaultName;
        this.counter = new AtomicLong();
    }

    @GET
    @Timed
    public Saying sayHello(@QueryParam("name") Optional<String> name) {
        final String value = String.format(template, name.or(defaultName));
        return new Saying(counter.incrementAndGet(), value);
    }
Validate your config and how it interacts with JMX /etc/init.d/datadog-agent jmx list_collected_attributes
2017-02-25 20:47:48,828 | INFO | dd.collector | jmxfetch(jmxfetch.py:242) | Starting jmxfetch:
2017-02-25 20:47:48,830 | INFO | dd.collector | jmxfetch(jmxfetch.py:290) | Running java -Xms50m -Xmx200m -classpath /opt/datadog-agent/agent/checks/libs/jmxfetch-0.12.0-jar-with-dependencies.jar org.datadog.jmxfetch.App --check jmx.yaml --check_period 15000 --conf_directory /etc/dd-agent/conf.d --log_level INFO --log_location /var/log/datadog/jmxfetch.log --reporter console --status_location /opt/datadog-agent/run/jmx_status.yaml list_collected_attributes

#####################################
Instance: localhost:7199
#####################################

       Matching: 1/350. Bean name: metrics:name=ch.qos.logback.core.Appender.error - Attribute name: Count  - Attribute type: long
       Matching: 2/350. Bean name: java.lang:type=Threading - Attribute name: ThreadCount  - Attribute type: int
       Matching: 3/350. Bean name: metrics:name=com.example.helloworld.resources.HelloWorldResource.sayHello - Attribute name: Count  - Attribute type: long
Go ahead and restart your Datadog agent and check its status as it gets started up.
/etc/init.d/datadog-agent restart
/etc/init.d/datadog-agent info
This Datadog command will show you a live stream of what its collecting /etc/init.d/datadog-agent jmx collect. I found it to be extremely usefully for debugging.
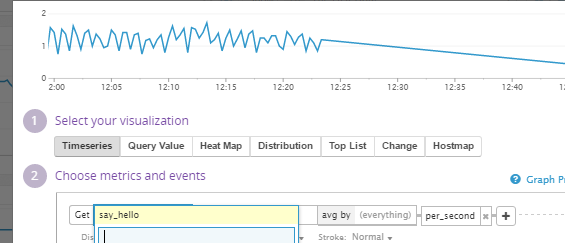
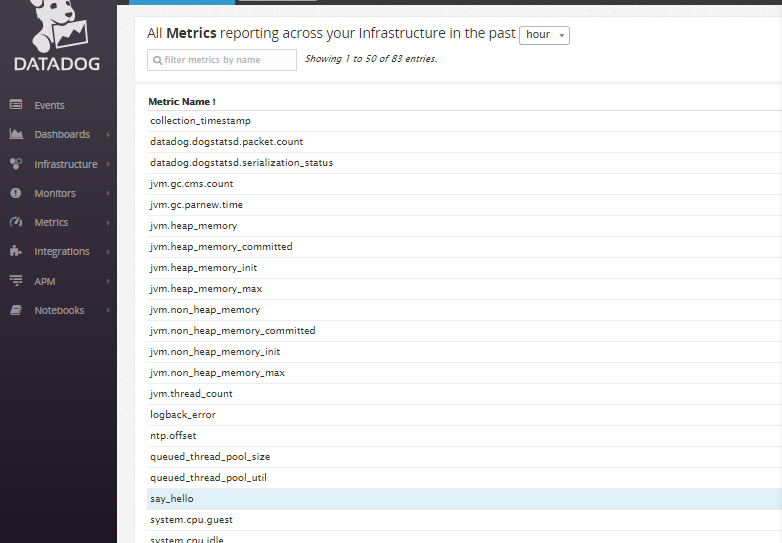
This should give you access to JMX data in Datadog. I found the Metrics Summary to be a useful tool to inspect my metrics before I tried building a Dashboard of them.
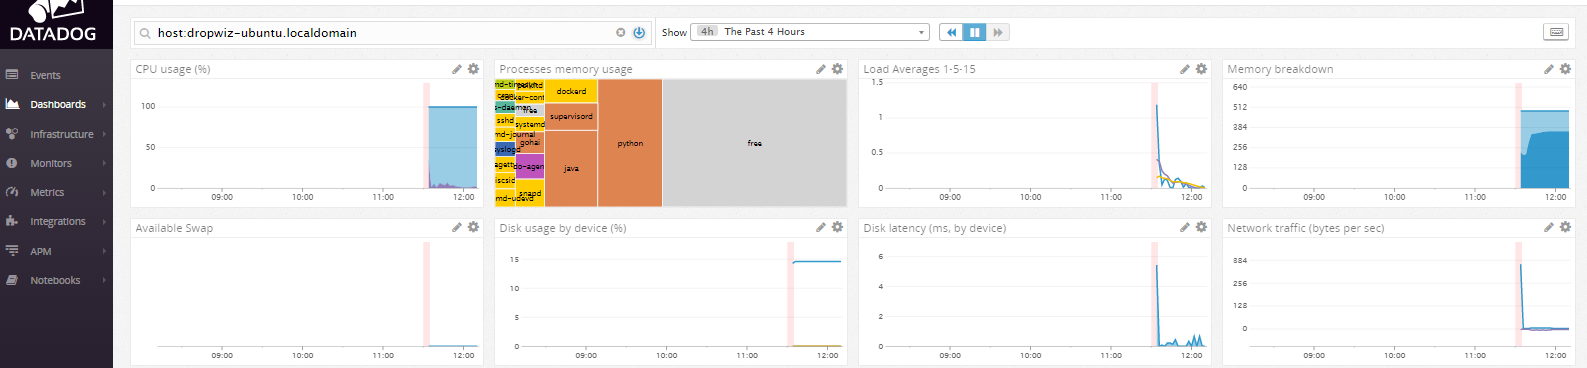
Now your ready for a basic dashboard.

Summary
That concludes our basic example, hopefully this let you see a very basic example running end to end. In the coming posts we will discuss running Dropwizard and the Agent in a container (instead of just on the raw host like we did here).